Dashboard reports
Read time, delivery, knowledge, AI and people in one place, with each product’s filters.
Dashboard is the reporting home for the suite. It does not replace a product’s own screen. It is where an owner or lead reads across them.
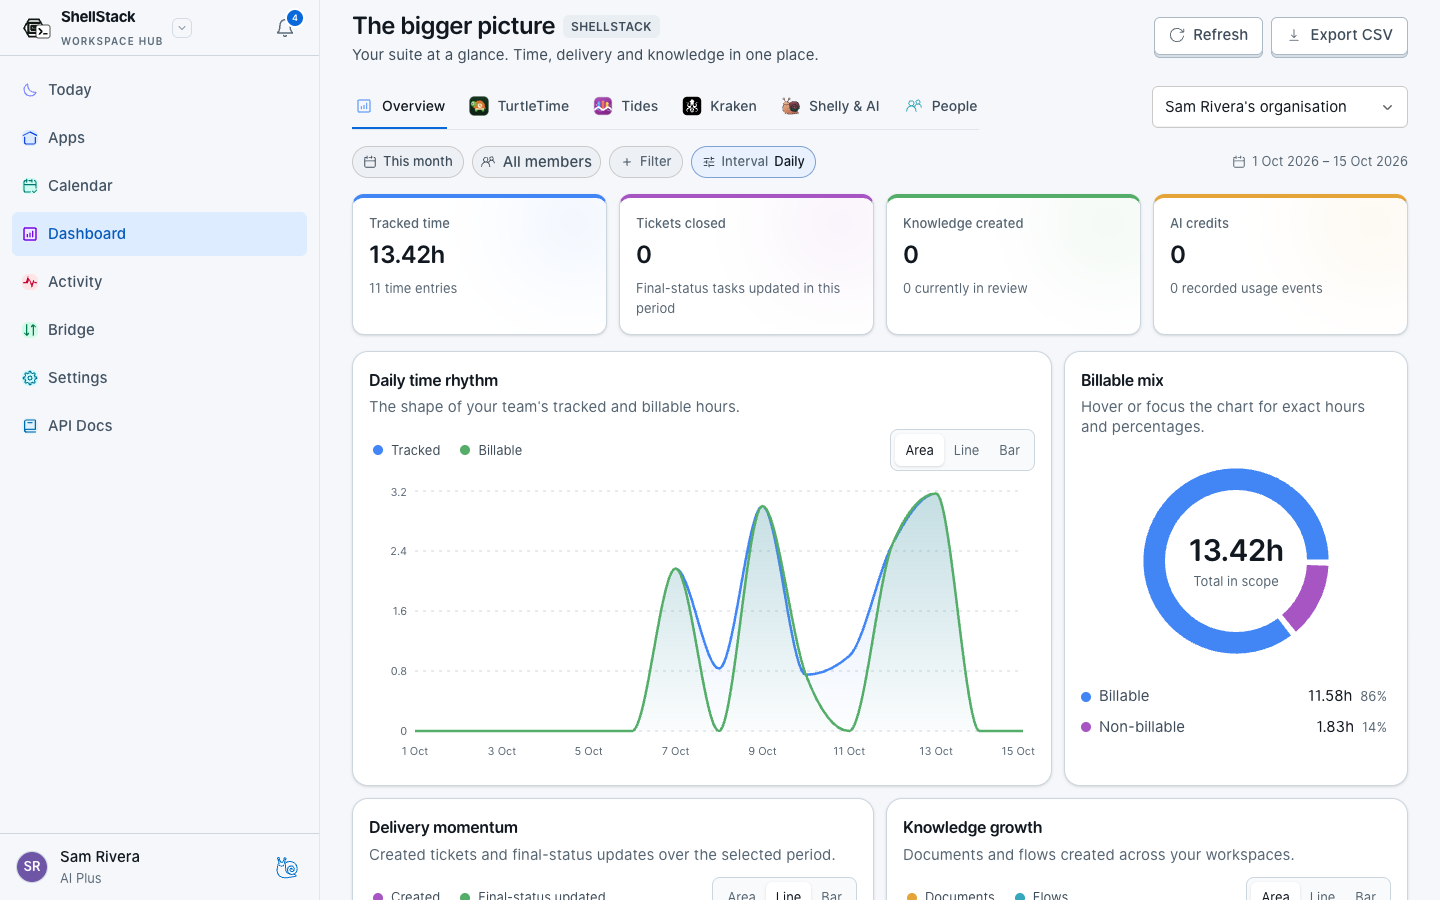
Tabs
| Tab | What it answers |
|---|---|
| Overview | The suite at a glance: time, delivery and knowledge together. |
| TurtleTime | Where hours went, what is billable, capacity and utilisation, project budgets and retainers. |
| Tides | Delivery: completion, workload and ticket charts, including monthly charts per assignee. |
| Kraken | Knowledge activity the viewer is allowed to see. Private pages stay private. |
| Shelly & AI | Crew and AI usage for the organisation. |
| People | Each member’s numbers. Administrators only. |
Filters
- Daily, weekly and monthly intervals are independent of the date range. Change one without resetting the other.
- Each product tab keeps that product’s own filters.
- People filters use the same member picker as Leave Calendar. People reports open on yourself. Add other people when you are allowed to see them.
- Export CSV from the report you are viewing.